
5K pace chart: 15:00 to 45:00
Find your 5K finish time and read across for the pace per kilometre, per mile and per 400 m lap you need to hold. Sub-20, sub-25 and sub-30 are highlighted.
| 5K time | Per km | Per mile | Per 400 m | km/h | mph |
|---|---|---|---|---|---|
| 15:00 | 3:00 | 4:50 | 1:12 | 20.0 | 12.43 |
| 15:30 | 3:06 | 4:59 | 1:14 | 19.4 | 12.03 |
| 16:00 | 3:12 | 5:09 | 1:17 | 18.8 | 11.65 |
| 16:30 | 3:18 | 5:19 | 1:19 | 18.2 | 11.30 |
| 17:00 | 3:24 | 5:28 | 1:22 | 17.6 | 10.97 |
| 17:30 | 3:30 | 5:38 | 1:24 | 17.1 | 10.65 |
| 18:00 | 3:36 | 5:48 | 1:26 | 16.7 | 10.36 |
| 18:30 | 3:42 | 5:57 | 1:29 | 16.2 | 10.08 |
| 19:00 | 3:48 | 6:07 | 1:31 | 15.8 | 9.81 |
| 19:30 | 3:54 | 6:17 | 1:34 | 15.4 | 9.56 |
| 20:00 | 4:00 | 6:26 | 1:36 | 15.0 | 9.32 |
| 20:30 | 4:06 | 6:36 | 1:38 | 14.6 | 9.09 |
| 21:00 | 4:12 | 6:46 | 1:41 | 14.3 | 8.88 |
| 21:30 | 4:18 | 6:55 | 1:43 | 14.0 | 8.67 |
| 22:00 | 4:24 | 7:05 | 1:46 | 13.6 | 8.47 |
| 22:30 | 4:30 | 7:15 | 1:48 | 13.3 | 8.28 |
| 23:00 | 4:36 | 7:24 | 1:50 | 13.0 | 8.10 |
| 23:30 | 4:42 | 7:34 | 1:53 | 12.8 | 7.93 |
| 24:00 | 4:48 | 7:43 | 1:55 | 12.5 | 7.77 |
| 24:30 | 4:54 | 7:53 | 1:58 | 12.2 | 7.61 |
| 25:00 | 5:00 | 8:03 | 2:00 | 12.0 | 7.46 |
| 25:30 | 5:06 | 8:12 | 2:02 | 11.8 | 7.31 |
| 26:00 | 5:12 | 8:22 | 2:05 | 11.5 | 7.17 |
| 26:30 | 5:18 | 8:32 | 2:07 | 11.3 | 7.03 |
| 27:00 | 5:24 | 8:41 | 2:10 | 11.1 | 6.90 |
| 27:30 | 5:30 | 8:51 | 2:12 | 10.9 | 6.78 |
| 28:00 | 5:36 | 9:01 | 2:14 | 10.7 | 6.66 |
| 28:30 | 5:42 | 9:10 | 2:17 | 10.5 | 6.54 |
| 29:00 | 5:48 | 9:20 | 2:19 | 10.3 | 6.43 |
| 29:30 | 5:54 | 9:30 | 2:22 | 10.2 | 6.32 |
| 30:00 | 6:00 | 9:39 | 2:24 | 10.0 | 6.21 |
| 30:30 | 6:06 | 9:49 | 2:26 | 9.8 | 6.11 |
| 31:00 | 6:12 | 9:59 | 2:29 | 9.7 | 6.01 |
| 31:30 | 6:18 | 10:08 | 2:31 | 9.5 | 5.92 |
| 32:00 | 6:24 | 10:18 | 2:34 | 9.4 | 5.83 |
| 32:30 | 6:30 | 10:28 | 2:36 | 9.2 | 5.74 |
| 33:00 | 6:36 | 10:37 | 2:38 | 9.1 | 5.65 |
| 33:30 | 6:42 | 10:47 | 2:41 | 9.0 | 5.56 |
| 34:00 | 6:48 | 10:57 | 2:43 | 8.8 | 5.48 |
| 34:30 | 6:54 | 11:06 | 2:46 | 8.7 | 5.40 |
| 35:00 | 7:00 | 11:16 | 2:48 | 8.6 | 5.33 |
| 35:30 | 7:06 | 11:26 | 2:50 | 8.5 | 5.25 |
| 36:00 | 7:12 | 11:35 | 2:53 | 8.3 | 5.18 |
| 36:30 | 7:18 | 11:45 | 2:55 | 8.2 | 5.11 |
| 37:00 | 7:24 | 11:55 | 2:58 | 8.1 | 5.04 |
| 37:30 | 7:30 | 12:04 | 3:00 | 8.0 | 4.97 |
| 38:00 | 7:36 | 12:14 | 3:02 | 7.9 | 4.91 |
| 38:30 | 7:42 | 12:24 | 3:05 | 7.8 | 4.84 |
| 39:00 | 7:48 | 12:33 | 3:07 | 7.7 | 4.78 |
| 39:30 | 7:54 | 12:43 | 3:10 | 7.6 | 4.72 |
| 40:00 | 8:00 | 12:52 | 3:12 | 7.5 | 4.66 |
| 40:30 | 8:06 | 13:02 | 3:14 | 7.4 | 4.60 |
| 41:00 | 8:12 | 13:12 | 3:17 | 7.3 | 4.55 |
| 41:30 | 8:18 | 13:21 | 3:19 | 7.2 | 4.49 |
| 42:00 | 8:24 | 13:31 | 3:22 | 7.1 | 4.44 |
| 42:30 | 8:30 | 13:41 | 3:24 | 7.1 | 4.39 |
| 43:00 | 8:36 | 13:50 | 3:26 | 7.0 | 4.34 |
| 43:30 | 8:42 | 14:00 | 3:29 | 6.9 | 4.29 |
| 44:00 | 8:48 | 14:10 | 3:31 | 6.8 | 4.24 |
| 44:30 | 8:54 | 14:19 | 3:34 | 6.7 | 4.19 |
| 45:00 | 9:00 | 14:29 | 3:36 | 6.7 | 4.14 |
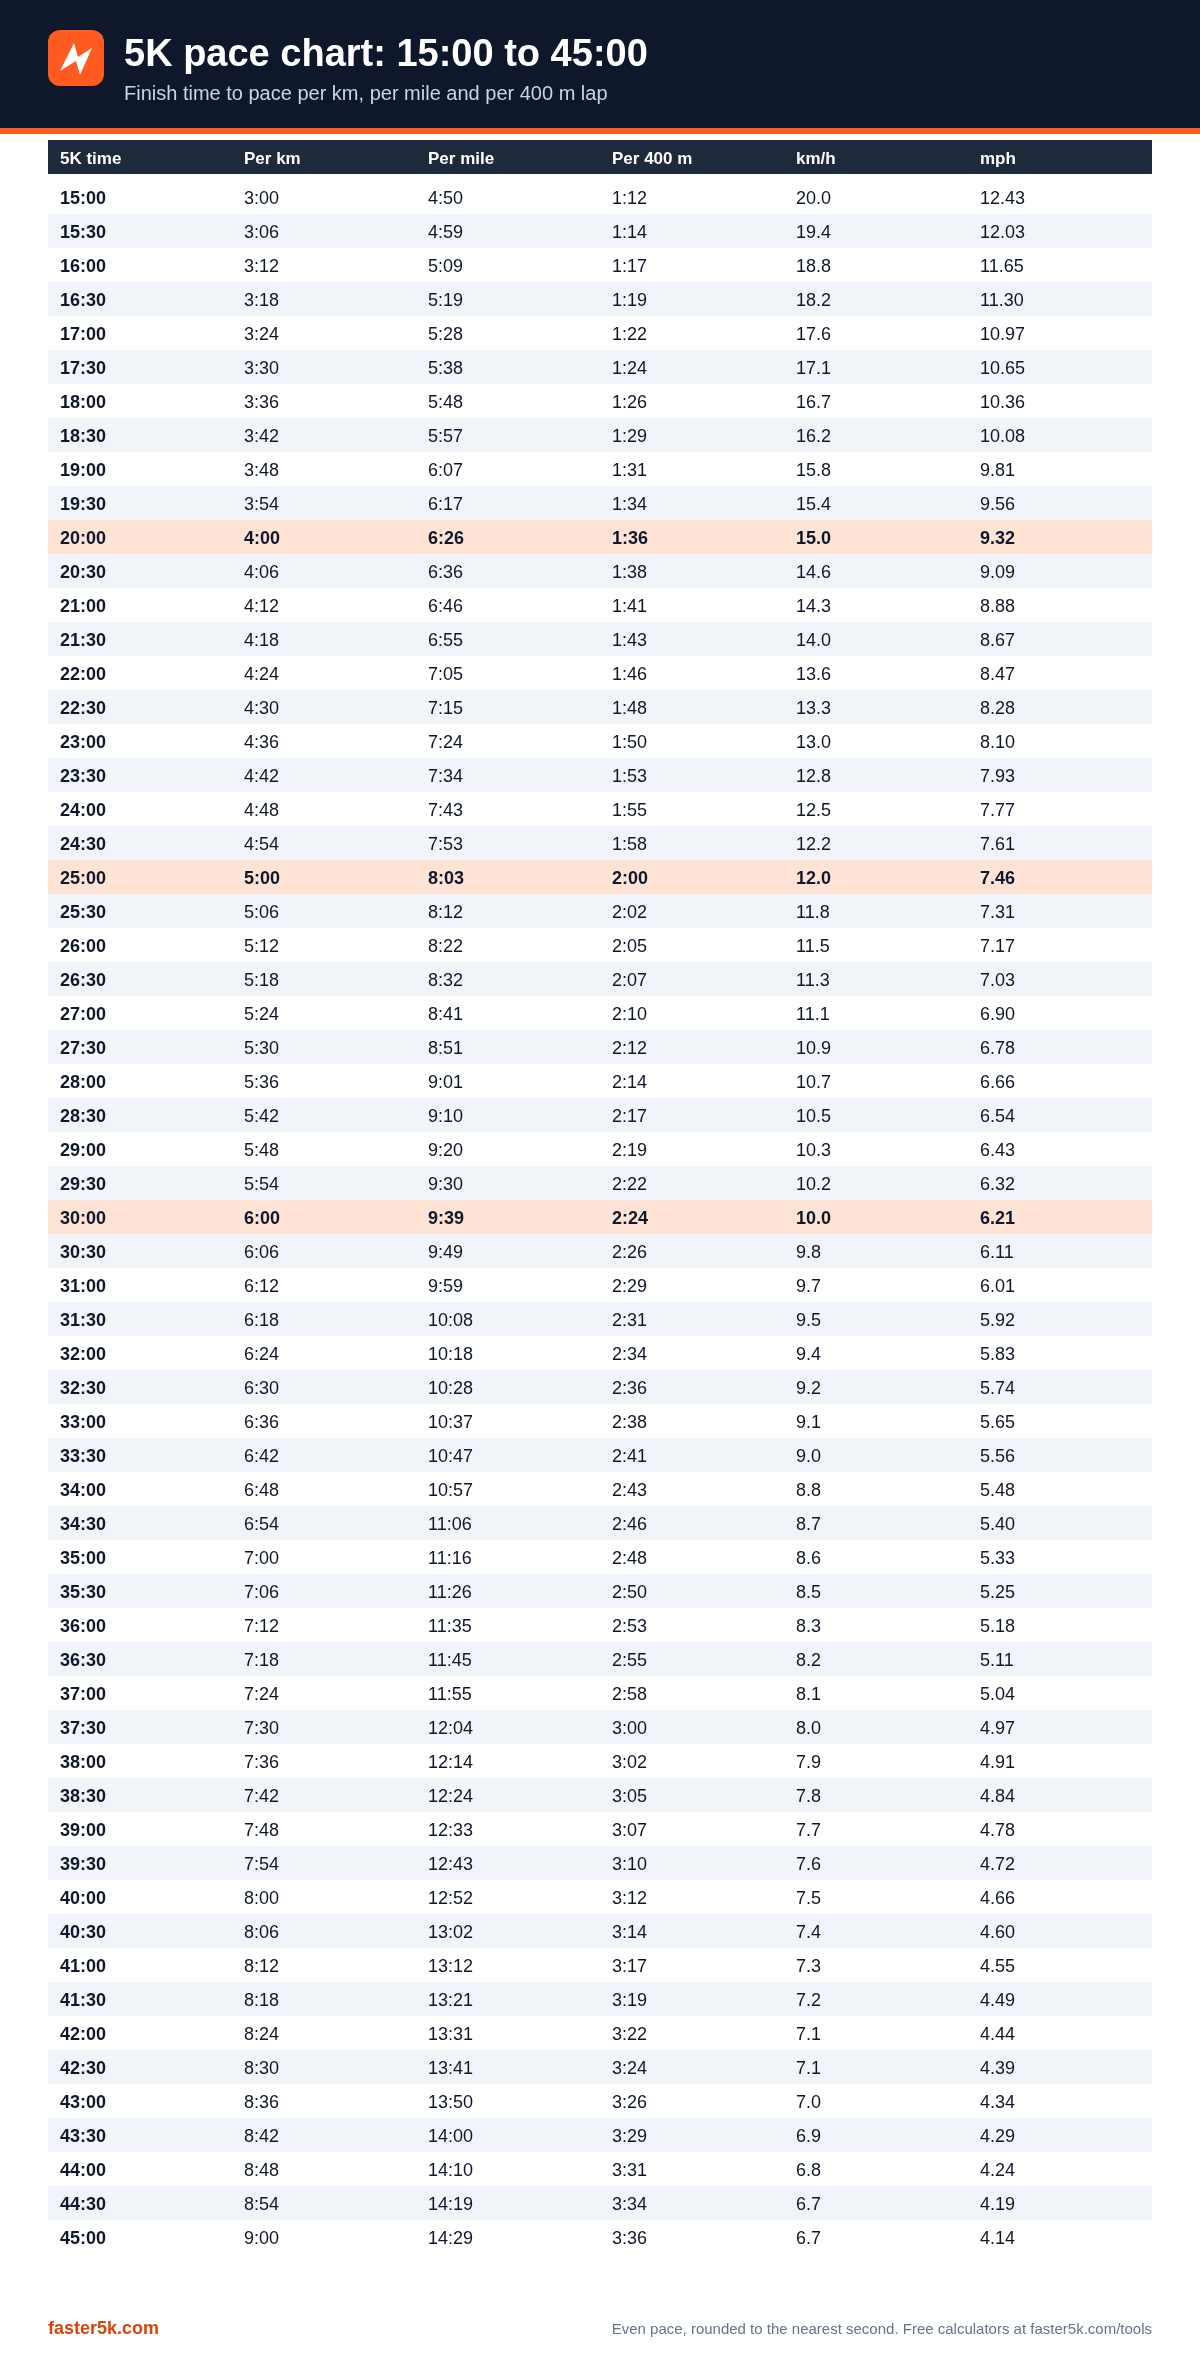

How to use this chart
Pick a realistic target, not a dream one. Use your most recent 5K or a time trial, then choose a goal a few percent faster. Note the per-km or per-mile pace and practise it in training. In a race, check your first split: if you're more than about 5 seconds per km faster than the chart, ease off. That early "free time" is usually paid back with interest in the final kilometre.
The chart assumes even pacing on an accurately measured course. Hills, heat, wind and crowded starts all add time. For checkpoint times at every km and mile, use the split calculator; for any other distance, use the pace calculator.
FAQ
What is the average 5K time?
It varies widely by age, sex and how many walkers are in the field, so a single "average" isn't very meaningful. Compare yourself with your own last result instead.
How many laps of a track is a 5K?
12.5 laps of a standard 400 m track. The "Per 400 m" column is your lap time.
Is 6:00 per km good?
6:00/km (9:39/mile) gives a 30:00 5K, a popular first milestone for newer runners.